Understanding the security challenges on AWS Cloud, CMC Telecom introduces Amazon Managed Grafana application solutions in monitoring Amazon RDS and Amazon Aurora to ensure data security when moving to the AWS cloud (AWS Cloud).
In the AWS cloud environment, log management and monitoring are important requirements to help users monitor system activities to detect and promptly handle arising problems. CMC expert introduces how to apply Grafana to log monitoring in Amazon RDS and Amazon Aurora services to minimize the risks of data insecurity on AWS Cloud.
What are Amazon RDS and Amazon Aurora services?
Amazon RDS (Amazon Relational Database Service) and Amazon Aurora are two database services managed by AWS. These two services both allow users to build, manage, and expand databases easily and effectively on AWS Cloud.
With Amazon RDS, this is a service compatible with many popular database management systems such as MySQL, PostgreSQL, Oracle, SQL Server and MariaDB. This allows users to choose the operating system that suits their application needs. With Amazon Aurora, the service offers exceptional support for MySQL and PostgreSQL. With outstanding advantages in helping businesses easily deploy, operate and manage database systems, the above two services have become two important services in operating data systems on AWS Cloud today. now.
In Amazon RDS and Amazon Aurora, businesses can choose from a variety of log types to record activities in their databases. Specifically, authentication logs, error logs, request logs, transaction logs and backup progress logs. These logs can be stored on Amazon S3 or Amazon Cloud Watch Logs. Using Amazon Cloud Watch Logs, users can create informative search filters to quickly find problems in their databases. At the same time, Amazon Aurora also has a similar operating structure. However, not only does it stop at storing and monitoring system logs through files and command lines, it also needs to be visualized into charts and images. This helps the operations engineering team to report data in a simple and optimal way.
Some important log types in Amazon RDS and Amazon Aurora
First, the database log records database activities, including queries and operations. The second is the error log to record errors that occur in the database, including system errors and application errors. And finally, the alert log is intended to record warnings about performance or other issues in the database.
Amazon Managed Grafana – Data visualization service
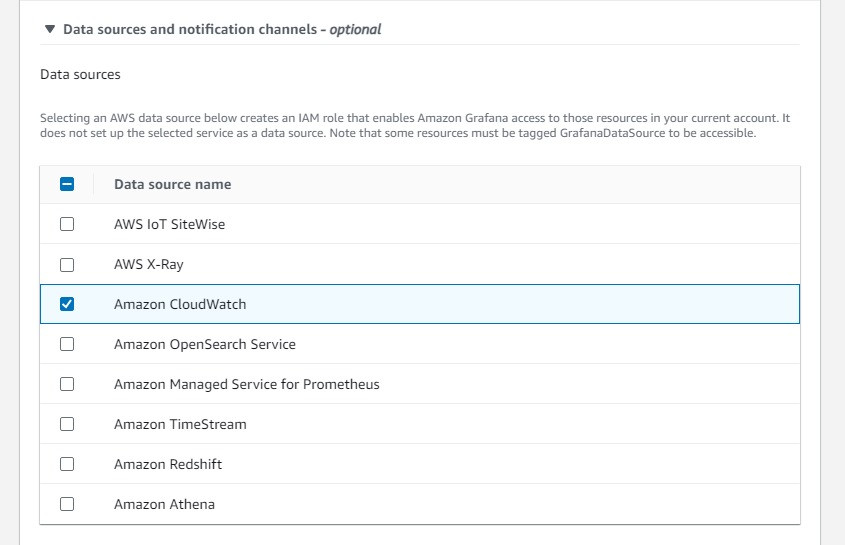
To meet the needs, AWS has added Amazon Managed Grafana to its product suite. Amazon Managed Grafana is a data visualization service. This service is managed and highly secure. In addition, this service also helps users query and correlate operational metrics quickly and is perfectly integrated from many different AWS data sources, such as Amazon Cloud Watch, Amazon OpenSearch Service, Amazon Athena and Amazon Managed Service for Prometheus (AMP)…
MultiCloud experts share: “Amazon Managed Grafana also provides plug-ins for popular open source databases, third-party monitoring tools and other cloud services. Using Amazon Managed Grafana, users can easily create innovative dashboards that aggregate information from multiple AWS services, accounts, and on-premises sources. Not only does it enable customized user access through the AWS IAM Identity Center or other SAML-based Identity Providers (IdPs), it also supports control over the specific objects that are accessed. access this service”.
Currently, there are many ways to apply Amazon Managed Grafana to system monitoring. To help readers easily visualize, experts from CMC Telecom visualize the service through a simple mechanism diagram that collects important indicators. Specifically including CPU usage, memory usage, and database connections from Amazon RDS and Amazon Aurora, and storing them in Amazon Cloud Watch.
Users can also manually deploy a custom Lambda function to collect RDS Performance Insight metrics and send them to Amazon Cloud Watch if necessary. Users can then instantiate Amazon Managed Grafana and connect to get data from Amazon Cloud Watch.
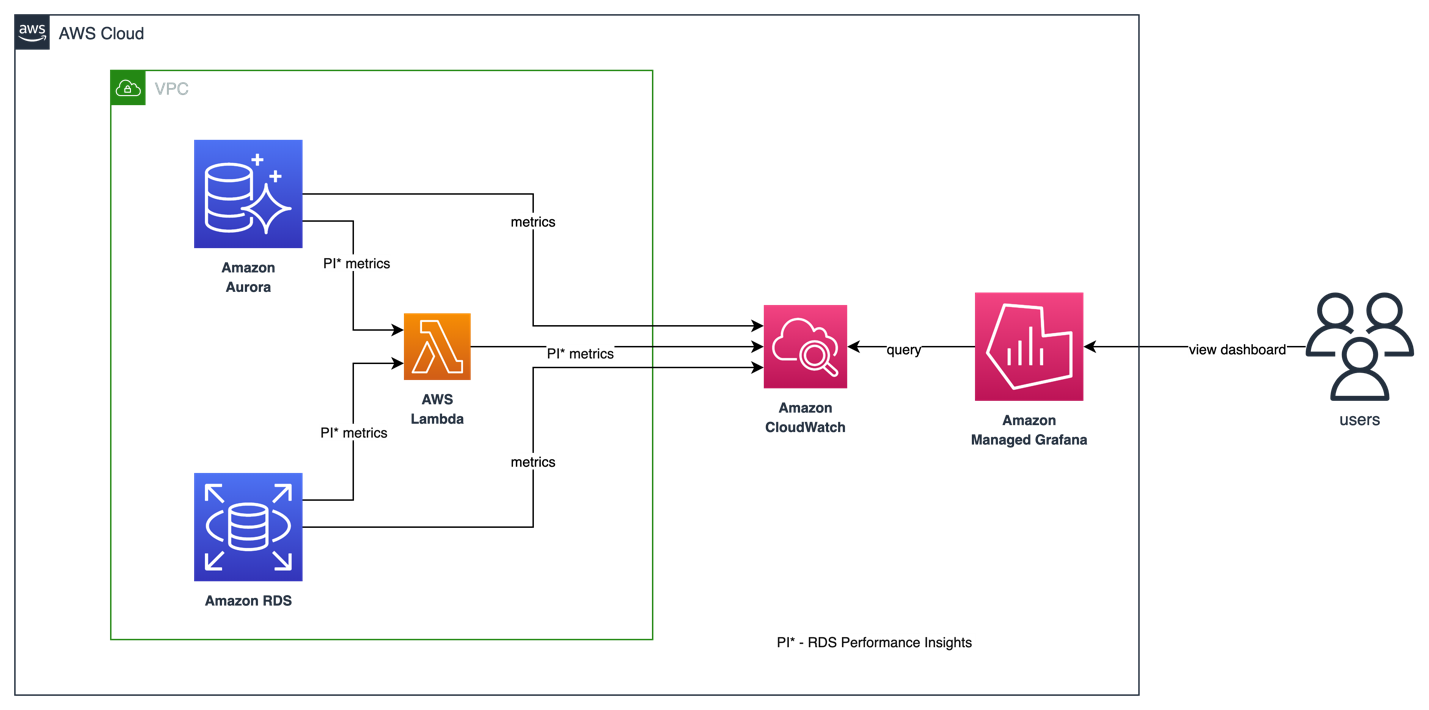
Overall architecture when using Grafana combined with Cloudwatch to monitor Amazon RDS
Steps:
Step 1: Prepare Amazon RDS or Amazon Aurora resources.
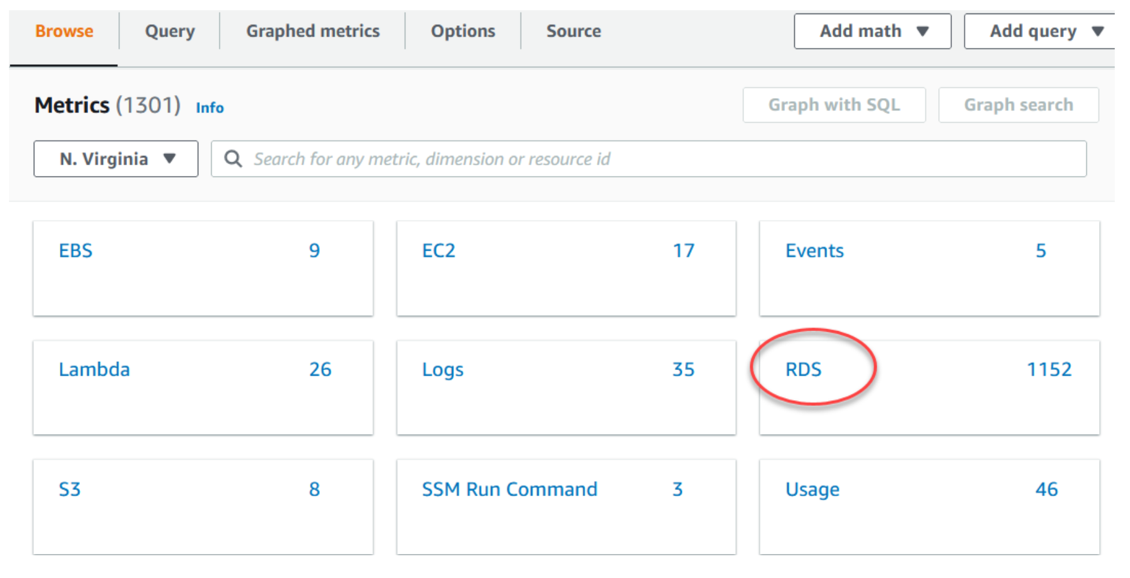
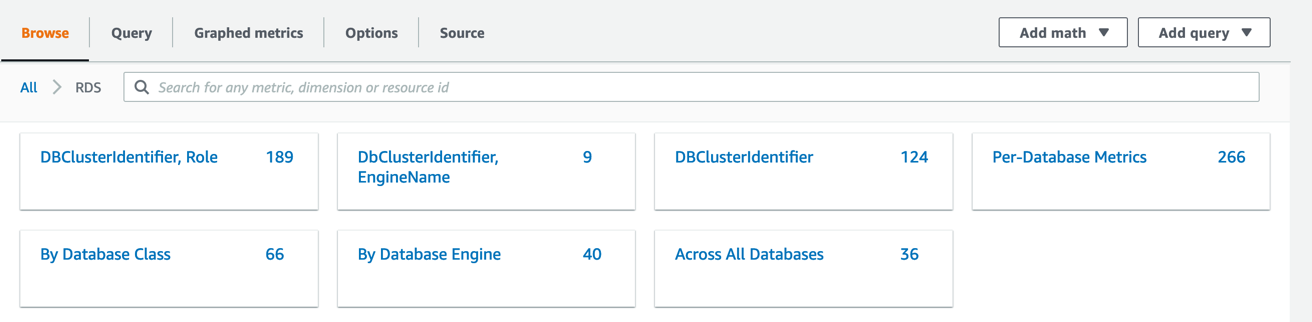
Step 2: Initialize Amazon Cloud Watch and enable the Amazon RDS or Amazon Aurora Metrics view in Amazon Cloud Watch. For example: Enable metrics for DBClusterIdentifier.
Step 3: Access the Grafana Console and create a new working environment, selecting Amazon Cloud Watch as the data source.
Step 4: Access the Grafana interface, configure information about Amazon Cloud Watch created from the above steps.
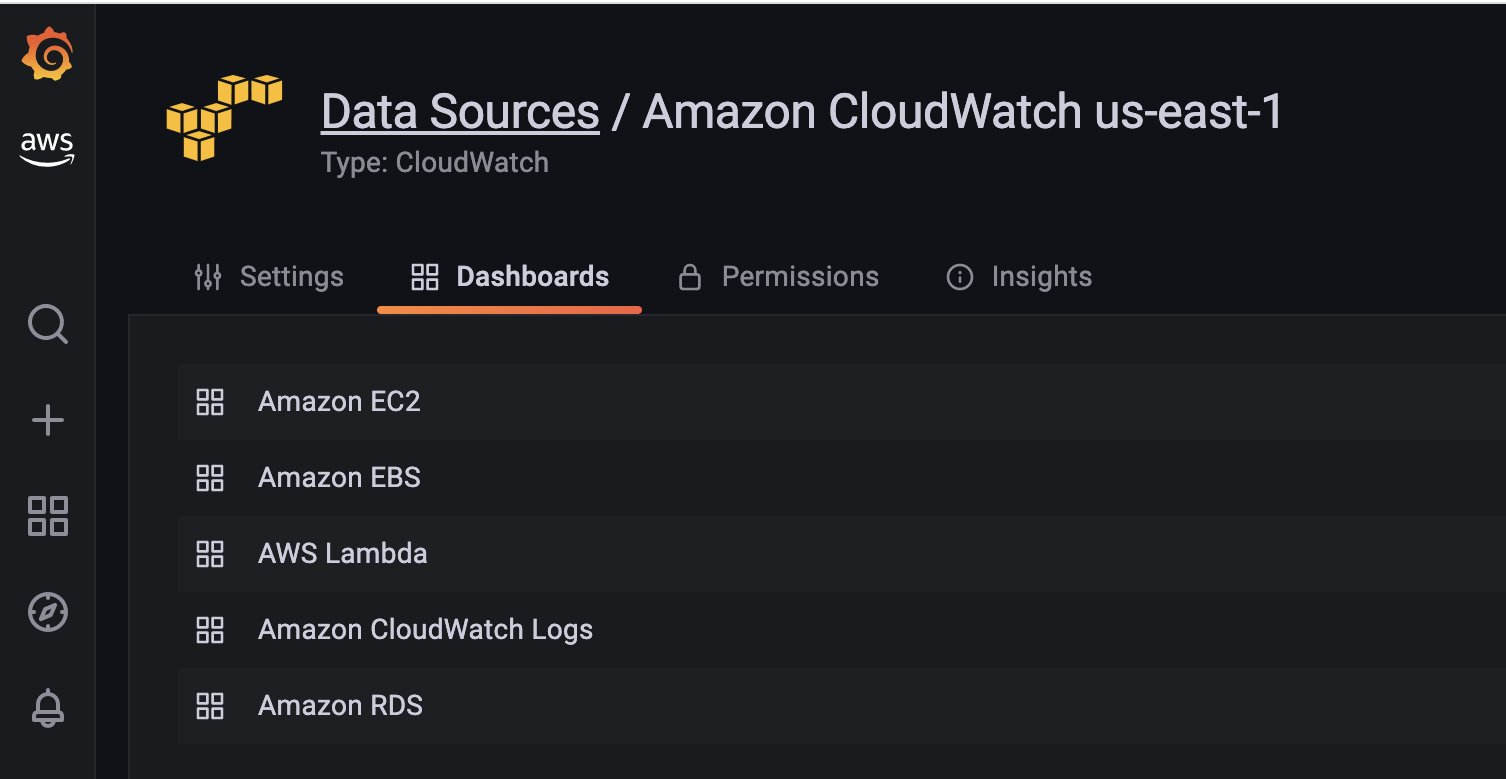
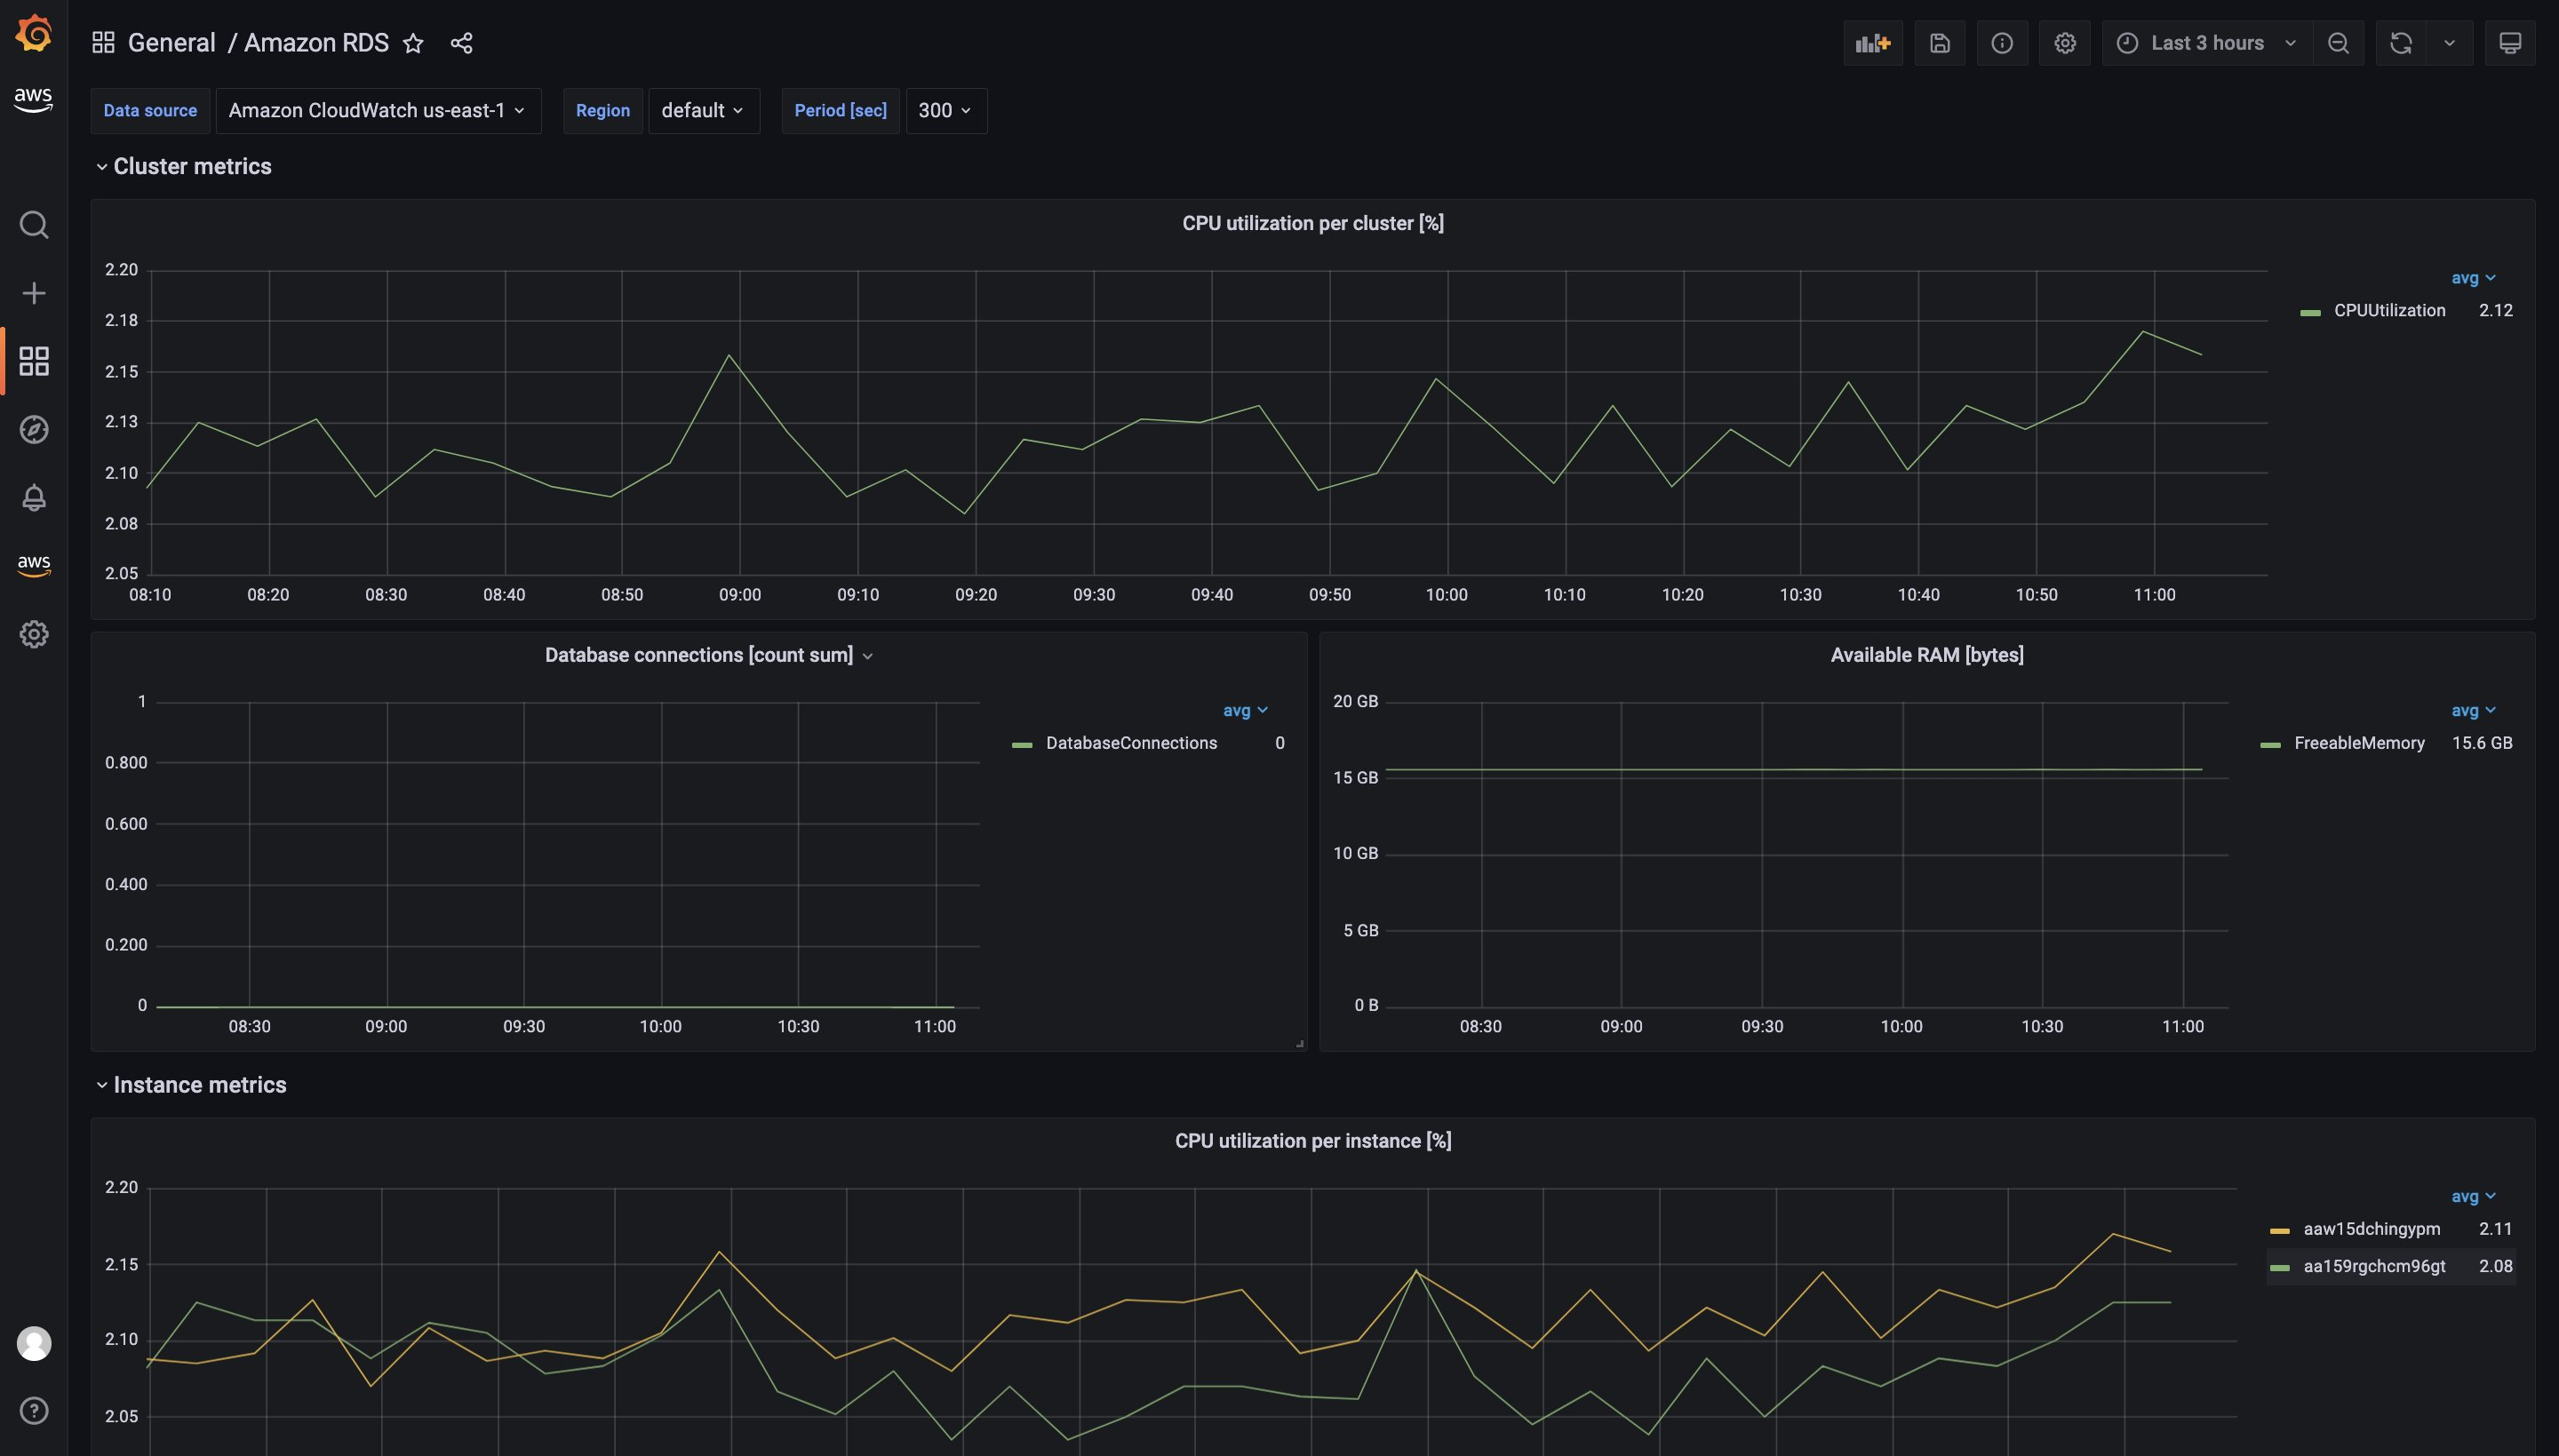
At the Dashboard interface, you can add charts to monitor each system information such as CPU, RAM, etc.
Users can also use Performance Insight (PI) to extend Amazon RDS or Amazon Aurora monitoring features. Need to monitor data download on RDS clusters, filter load in real time… In addition, Grafana can support users to map those parameters.
Step 1: Use AWS CloudFormation to deploy the Lamda function to initialize the environment. The Lamda function will automatically call the RDS Performance API every 10 minutes.
Step 2: Configure the source data on the Grafana interface
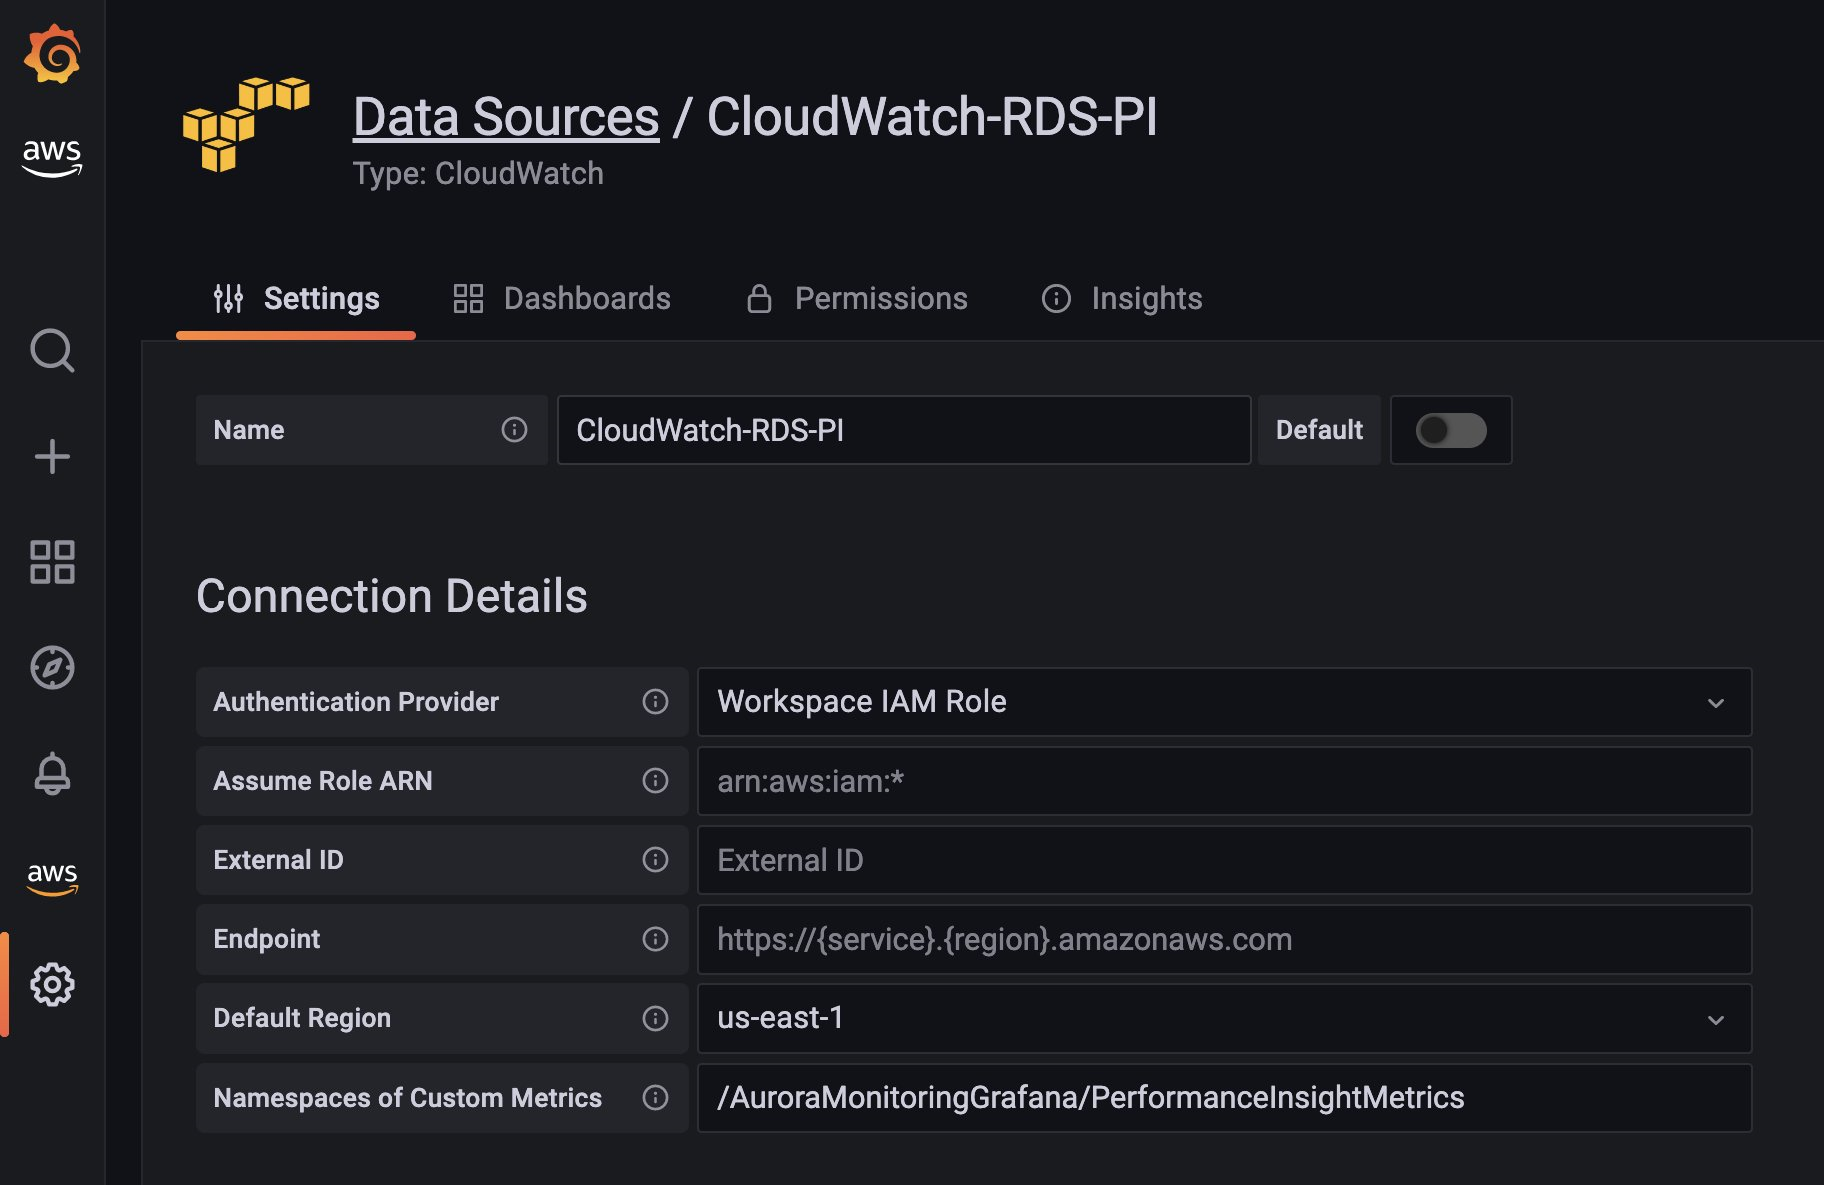
Using Database Load (DbLoad) combined with data sources from RDS Perfomance Insight supports users in mapping system load information.
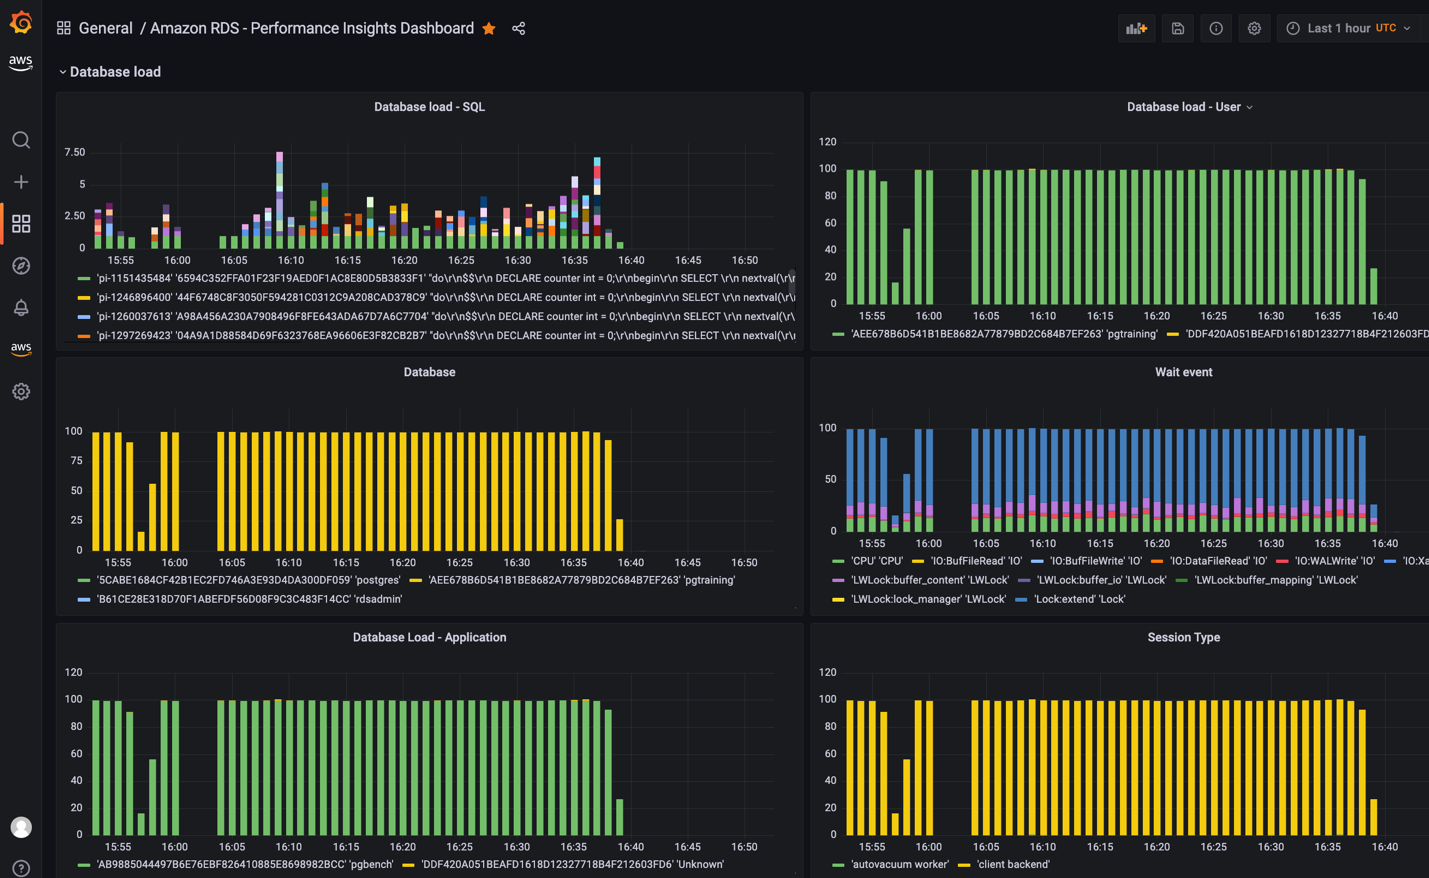
Using Top Load Events will display running components consuming Database resources
CMC Telecom experts assess that monitoring Amazon RDS and Aurora logs with Amazon Managed Grafana requires businesses to have knowledge of how to query data from the database and create charts. Currently in Vietnam, CMC Telecom is a Premier Service Partner of AWS in Vietnam. At the same time, this business also became an AWS Migration Competency partner in August.